Bring your ideas to life
One platform, infinite possibilities
Infographics
Create data-rich infographics from reports and summaries with beautiful, modern designs.
Technical Diagrams
Visualize complex systems, workflows, and technical concepts with precision.
Annotated Views
Automatically label and explain parts of your images with smart annotations.
See what you can create
Explore stunning visuals created with Infographics AI
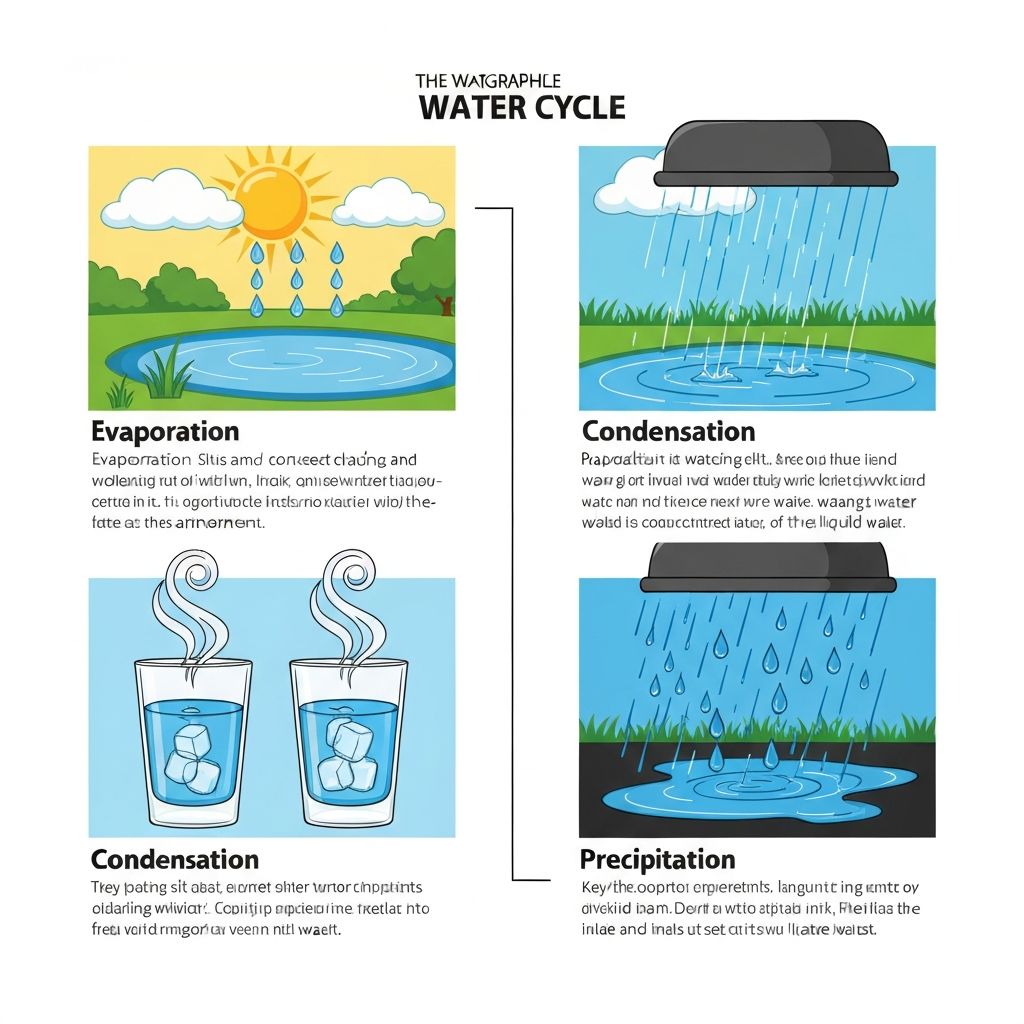
Water Cycle Process
Educational infographic explaining evaporation, condensation, and precipitation
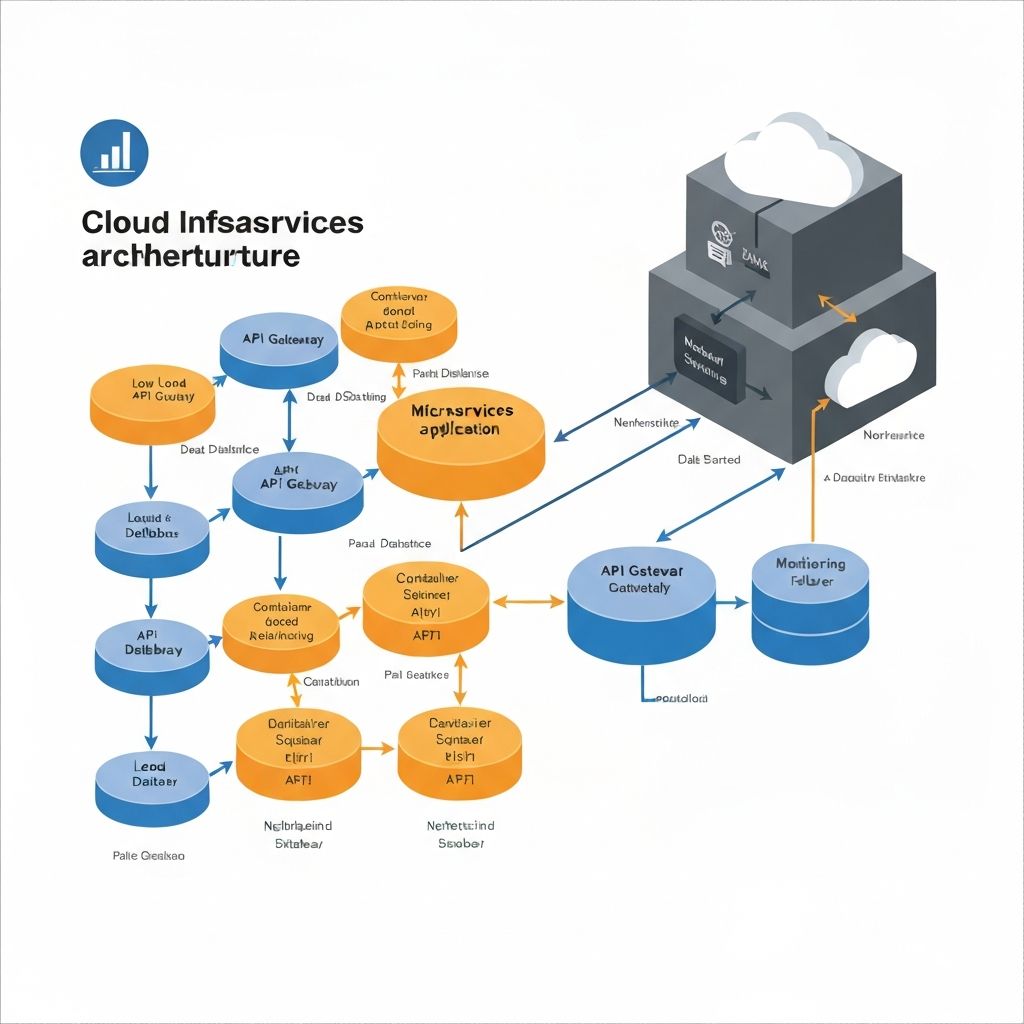
Cloud Architecture
Technical diagram showing microservices infrastructure and data flow
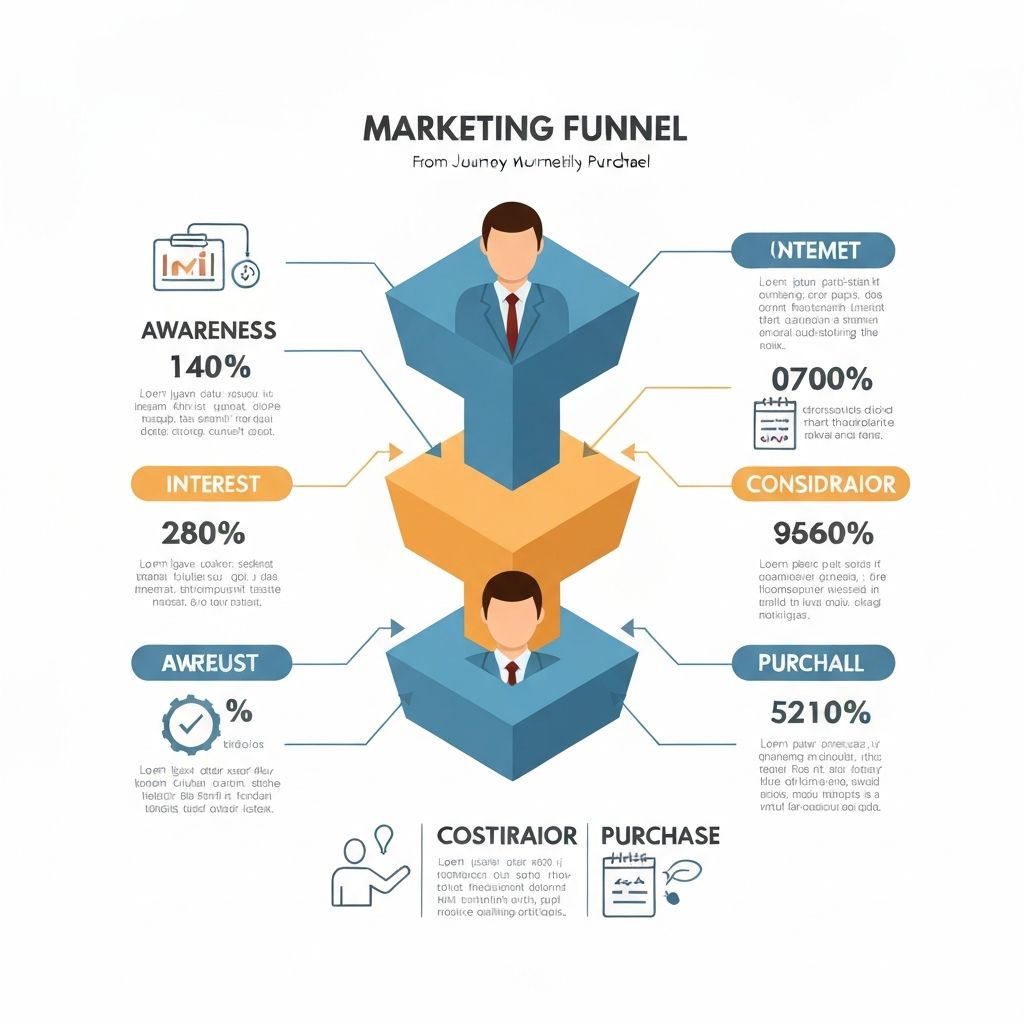
Marketing Funnel
Visual representation of customer journey from awareness to purchase
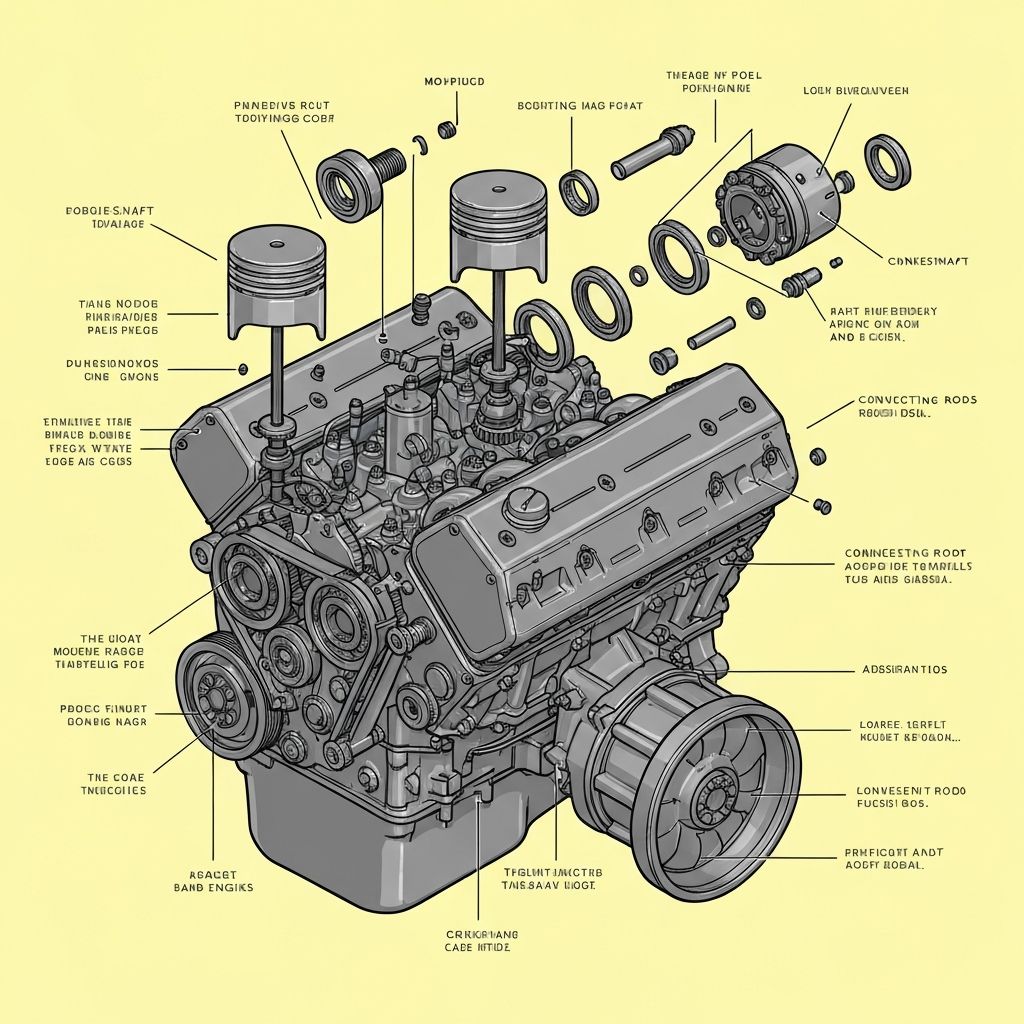
Engine Components
Detailed exploded view showing mechanical assembly and parts
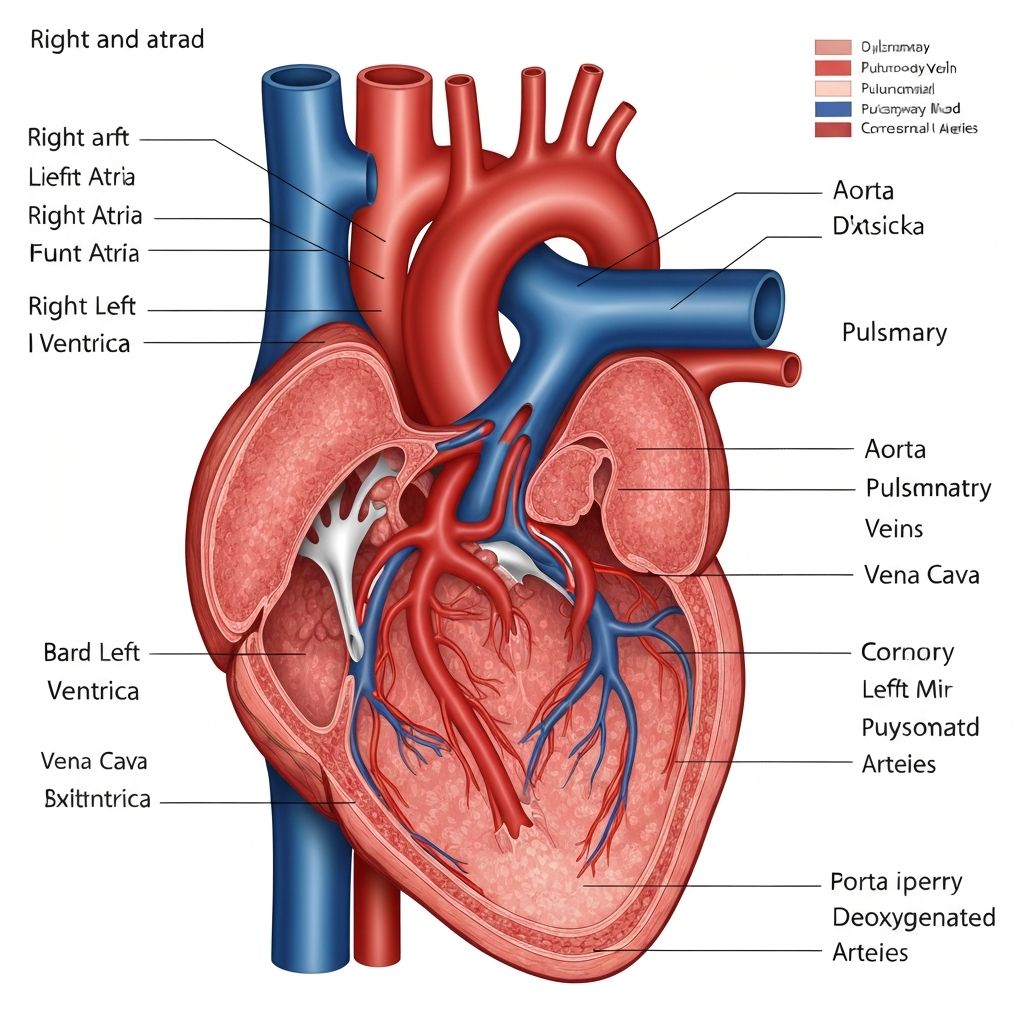
Heart Anatomy
Annotated diagram with labeled chambers and blood vessels
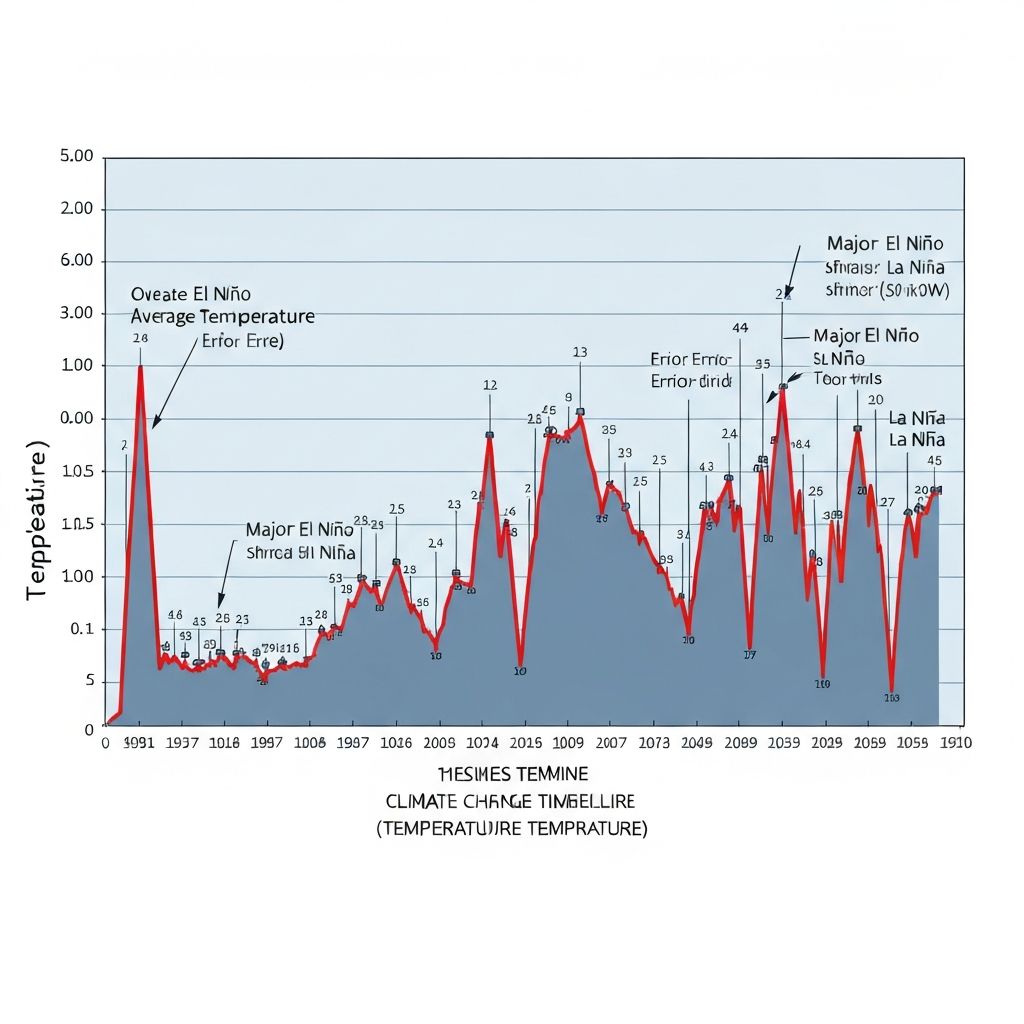
Climate Timeline
Historical temperature data visualization showing climate trends
Simple, transparent pricing
Choose the plan that works best for your needs